Table of Contents
Generate the statistic:- runs wireshark and starts capturing the network packets until the statistic builds.
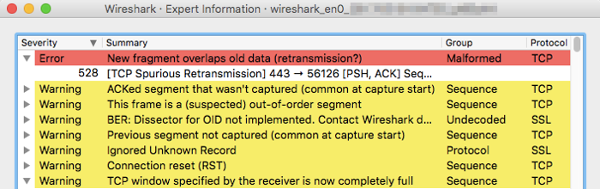
Quick drill into errors and connection issues
-
Navigates to → , a high number of errors and warnings indicates problems.
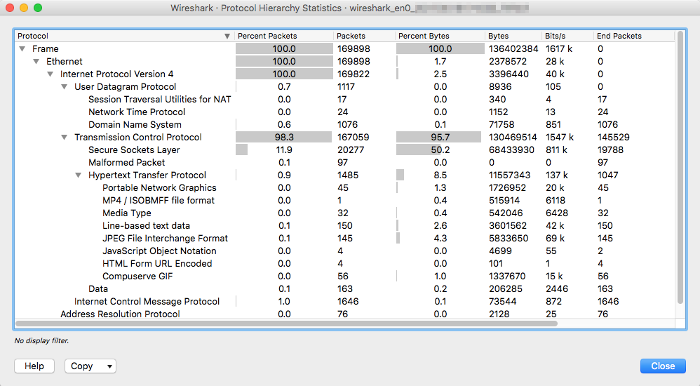
Identify the protocols with high traffic
-
Navigates to → :
-
Observes the resulting and pins down the suspicious/troubling protocol (e.g., high percentage of P2P or broadcast), right-click and select → to apply the filter for further analysis.
Get the connection speed to a site
-
Use a display filter such as
ip.addr == 192.168.1.7 && ip.addr == 202.170.56.12 && tcp.port == 22to filter the SSH traffic of the target site.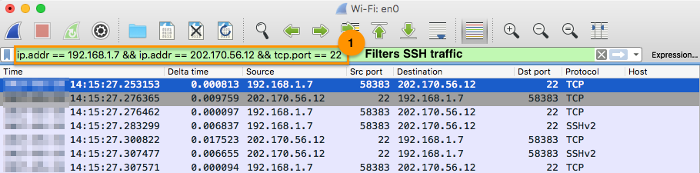
-
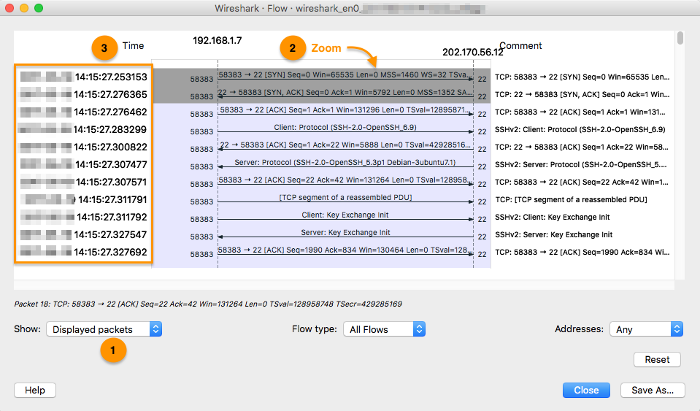
Navigates to Wireshark app’s menu → .
- Select show only .
- Right-click on the TCP flow diagram and zoom to increase the details of the packet.
- Observe the connection establishment timestamp and response time. High number of retransmissions, and re-established connections indicate problems.
Get the time spent in waiting for a response
-
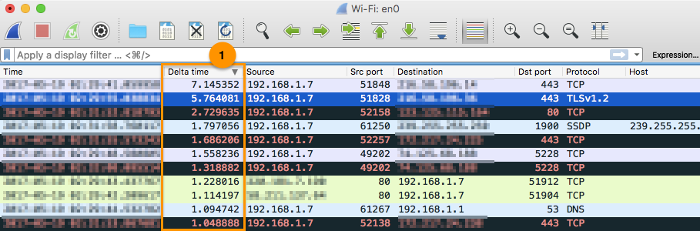
To show the time difference from the previous packet, add the into the display columns. From the column displays, right-click and select → add a new column and set the type as .
Identify the bad packets (TCP errors) ratio
-
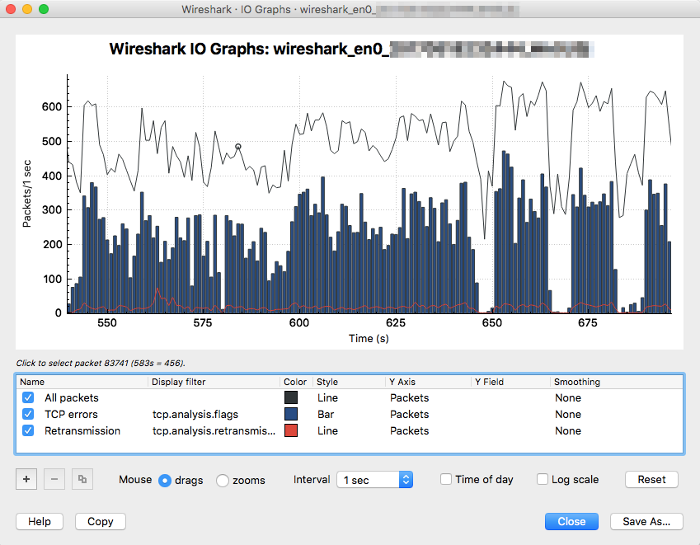
Navigates to → . Customizes the IO graphs with:
- TCP errors (
tcp.analysis.flags) to filters the bad TCP packets. - Retransmission (
tcp.analysis.retransmission || tcp.analysis.fast_retransmission) filters the retransmitted packets.
A consistently high TCP errors and retransmission ratio often indicate problems. For instance, approx. half of the total packets were indicated in figure below:
- TCP errors (