Background
The following setup is intended to streamline the column display for effective analysis when looking at HTTP and HTTPS traffic. The default columns are: ‘No (Packet number)’, ‘Time’, ‘Source’, ‘Destination’, ‘Protocol’, ‘Length’, and ‘Info’.
Table of Contents
Changing the column display
-
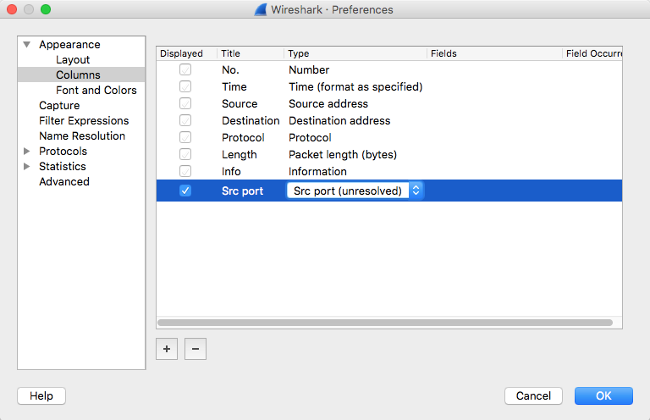
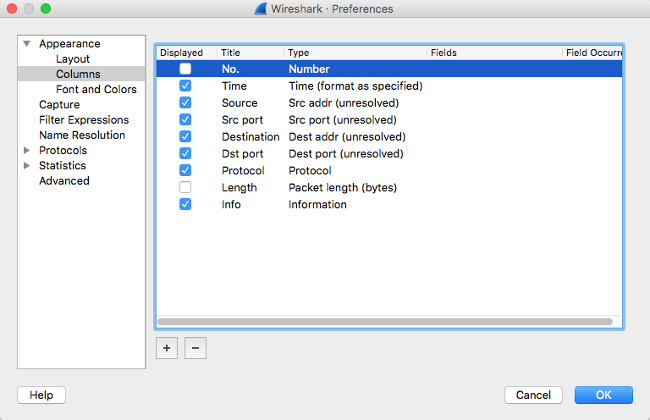
To change the default column display, navigate to ‘Preferences’:
From the ‘Preferences’, expands ‘Appearance’ and select ‘Columns’, then add the new desired column e.g., ‘Src port’ of type ‘Src port (unresolved)':
-
The following shows the final column settings, ‘No (Packet number)’ and ‘Length’ are removed, ‘Source’ and ‘Destination’ addresses changed to ‘unresolved’ to shows actual ip address. Additionally, two new columns: ‘Src port’ and ‘Dst port’ (both ‘unresolved’) are added to shows actual port number.
Changing the Time Display Format
-
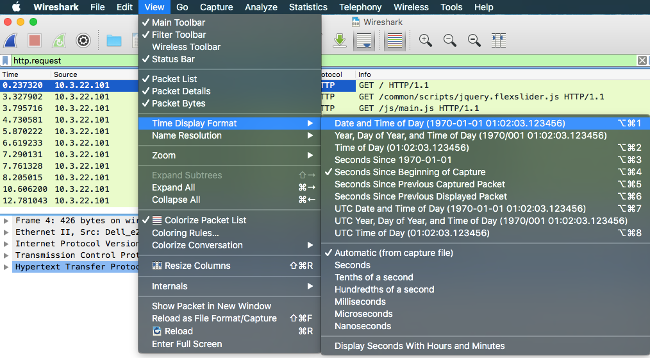
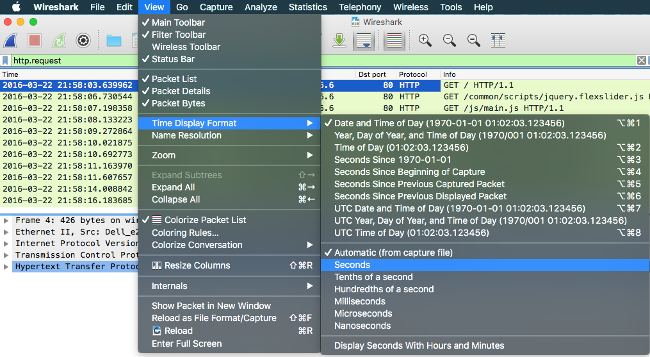
The default format is ‘Seconds Since Beginning of Capture’ which isn’t useful if the time of the day is of interest. To change it, navigate to ‘View’ → ‘Time Display Format’, and select ‘Date and Time of Day’:
-
Also, change the time precision to ‘Seconds’ to shorten the space required:
Adding HTTP Server Names
-
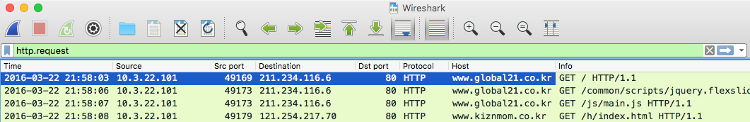
Set the display filter as '
http.request' to only display HTTP requests. Then, from the ‘Packet Details’ pane, expand the ‘Hypertext Transfer Protocol’ and right-click ‘Host’ from the HTTP header and select ‘Apply as Column’ :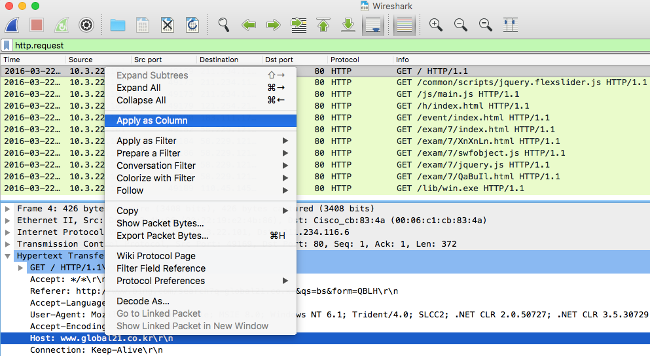
-
The host from the HTTP requests (both GET and POST) will now shown as a column. The final column settings are:
- Time (Date and Time of Day): YYYY-MM-DD HH:MM:SS
- Source Address (unresolved)
- Source Port (unresolved)
- Destination Address (unresolved)
- Destination Port (unresolved)
- Protocol
- Host
- Info
Adding HTTPS Server Names
-
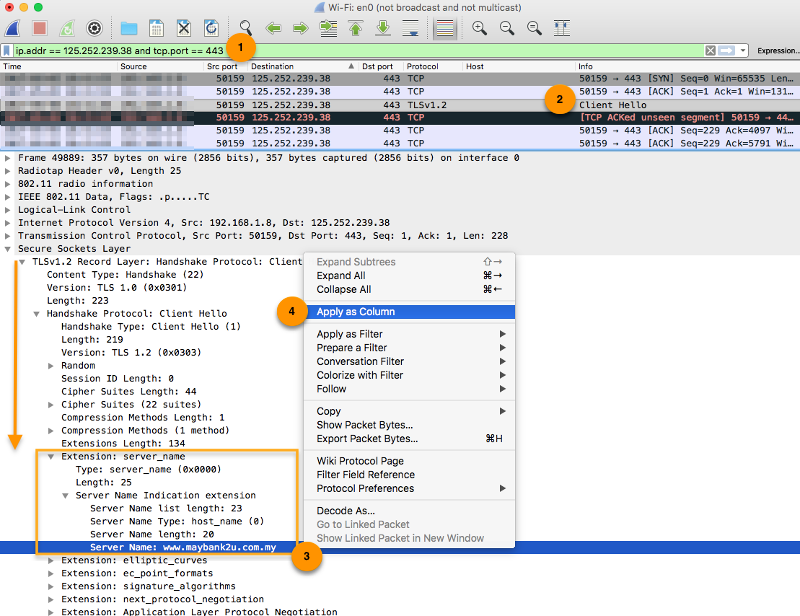
Use a display filter such as
tcp.port == 443to narrow down the HTTPS traffic. -
Look for ‘TLS’ or ‘Client Hello’ from the Protocol and Info columns.
-
Expand the ‘Secure Sockets Layer’ → ‘TLSv1.2 Record Layer’ → ‘Handshake Protocol’ → ‘Extension: server_name’ → ‘Server Name Indication extension’, select the ‘Server Name’ field.
-
Then, right-click on the field and select ‘Apply as Column’:
-
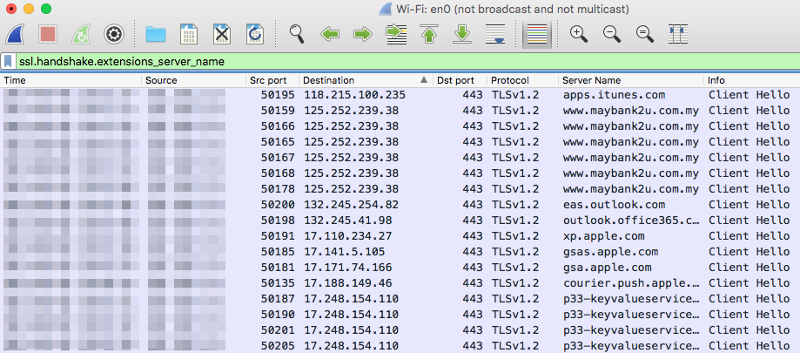
Use the
ssl.handshake.extensions_server_namedisplay filter to query server names from the HTTPS traffic: